
Measure what matters and reference measures matter
Elevating metrics with reference measures for quality reporting and insights

Metrics matter. The right metrics also matter. It’s important to measure what matters. John Doerr said that and he’s right. At the same time, I also think, the essence lies not just in the key metric itself, but how it is communicated and shared with the right context. Context is king.
Reference Measures
Encountering a metric in isolation often results in a lack of clarity. It’s a common challenge. I interacted with a recent slew of reports, presentations and updates with metrics that completely failed me to understand what is going on. The failure there lies in context.
In essence, while measuring what matters is foundational, providing context is equally, if not more, crucial. Reference metrics fill context gaps and can turn simple metrics into true insights. It’s a matter of high reporting quality.
A reference context framework
To ensure maximum clarity and context for any metric displayed in a key report, presentation or metric headline, the key lies in extending it with relevant reference measures. 4 dimensions come to mind that can help transform a simple metric into action, insight or story.
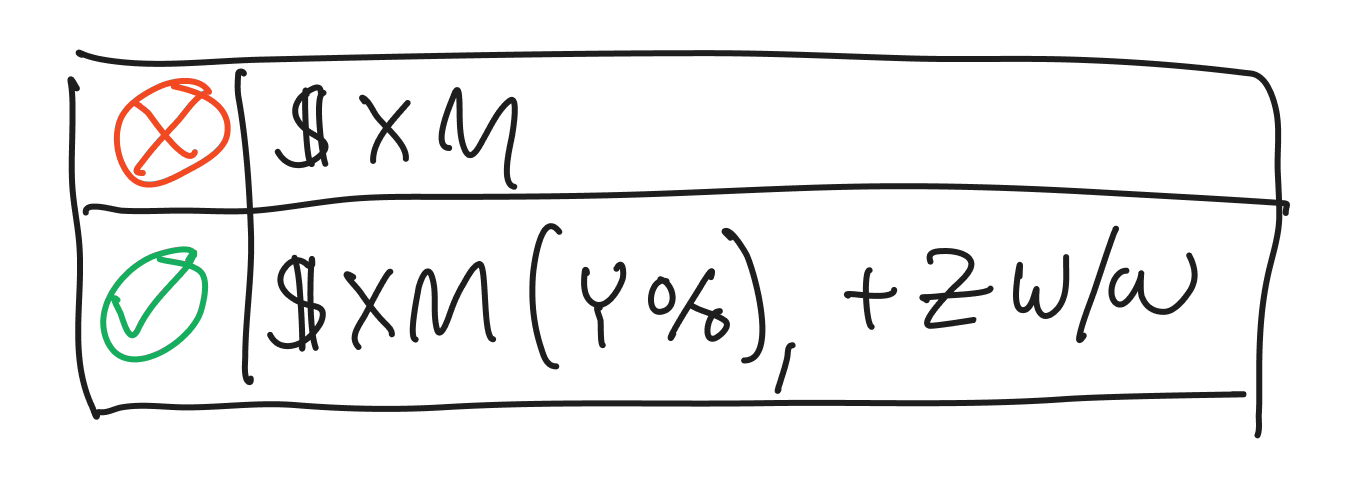
Reference against the objective
Every key metric should have an objective; a target, a goal. Otherwise, why are you measuring what you’re measuring? Anyway, given there is an objective, by referencing the key metric against its objective, the narrative gains depth. Let's take a few examples:
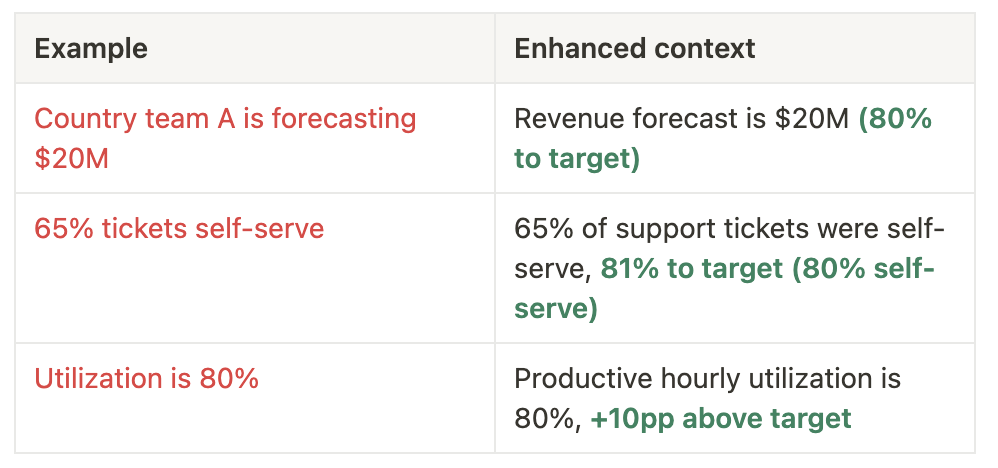
The latter, context enhanced, examples in the table not only highlight the metric, but also place them in relation to their objective and thus provide the necessary context to understand them. It’s easy to leave it out, but not having it is a key miss when it comes to high reporting quality.
Reference against time
Metrics evolve over time, and tracking change should become an integral part of the metric context. Introducing a time dimension enhances understanding. Consider the impact of time on forecasting:

Aligning the metric with a relevant time interval is important to provide the right context. It matters less what the time interval is, but that it is is relevant. And you can always have more than 1 reference against time (e.g. week-on-week and year-over-year).
Personally, I find the meeting cadence a good proxy for the time interval. So if you meet weekly to review a metric, you should track the number and compare it week-over-week. No change, fine, say no change, but show it.
Reference to a cohort
Change is multifaceted. It can span products, teams, regions and much more. Key metrics within a cohort, can be referenced against it’s cohort, helping shape nuanced insights. For example, imagine that Country Team A is part of a larger set of other teams:
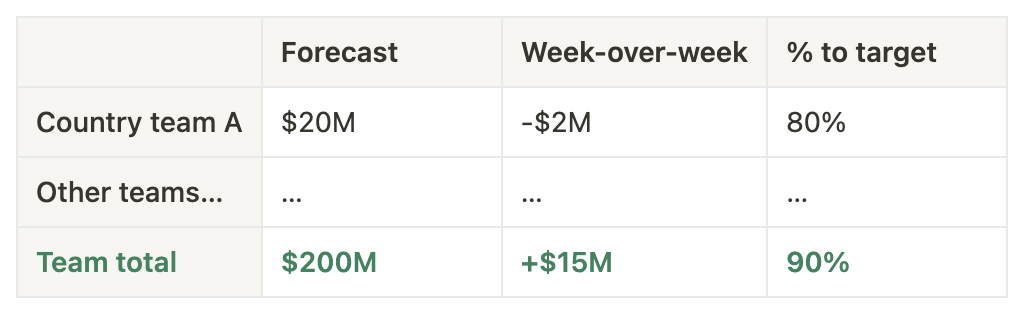
Analyzing the cohort metrics, reveal much more about the forecast metric. In a headline, you could summarize it as follows:
Country team A lowered forecast by -$2M to $20M (80% to target), falling behind in terms of on target performance vs. the team total, which is at 90% to target.
Great context on the forecast metric of $20M, right?
Dependency reference
Understanding dependencies is key to interpreting metrics. While not always critical, surfacing dependencies, especially when they drive significant changes, adds depth and meaning. For example, take win rate as a ratio metric as an example.

In this example, the interplay of wins and inbound metrics highlights the nuances behind a seemingly positive change in the win rate metric.
Another example. Take a look of Meta’s recent earnings report with one of their headlines:
Family Daily Active People (DAP) was $3.19 billion on average for December 2023, an increase of 8% year-over-year.
So what drove the 8% year-on-year increase? Was it more people? Was it same amount of people but more active? Or did a new product get added into the family of apps? Hard to know without additional context.
Bringing it all together
Unlocking more context for metrics is not that hard. Most of the necessary data is readily available to the metric owner; the only extra effort required is to display it alongside the metric. The benefit to context far outweighs the extra reporting effort to display it in tables, reports or headlines.
So for any metrics, my push is clear, it’s not just about measuring what matters, it’s also about the context provided alongside a metric. Without reference measures, a metric is of low reporting quality and not worth much.